
January 8, 2019
In its second year of annual analysis, the Rockefeller Institute of Government has examined the distribution of Federal Budget receipts and expenditures across the United States. This report examines where Federal funds are generated and spent, the balance of payments differential that exists between states, the primary explanations for those differences, and how these gaps may change over time.
Our annual analysis is designed to aid policymakers as they continue to discuss whether there is too much redistribution or too little, and the impact of those redistribution decisions on states. The Rockefeller Institute examined detailed revenue and spending data for Federal Fiscal Year (FFY) 2016 and developed a preliminary data series for FFY 2017, paying close attention to New York.
The findings are clear: New York’s residents and businesses — which consistently send more revenue to the Federal government than any other state — continue to contribute more in taxes than the state receives back in Federal spending. Key findings from this year’s report include:
+ Preliminary analysis of 2017 data indicates that at -$35.6 billion, New York’s overall balance of payments remains the least favorable of any state in the nation. New York maintains its rank from 2016 (-$38.6 billion).
+ New York’s shortfall in 2017 is nearly as large as that of second-ranked New Jersey (-$21.3 billion) and third-ranked Massachusetts (-$16.1 billion) combined. Connecticut and Illinois round out the list of the states with the least favorable balances.
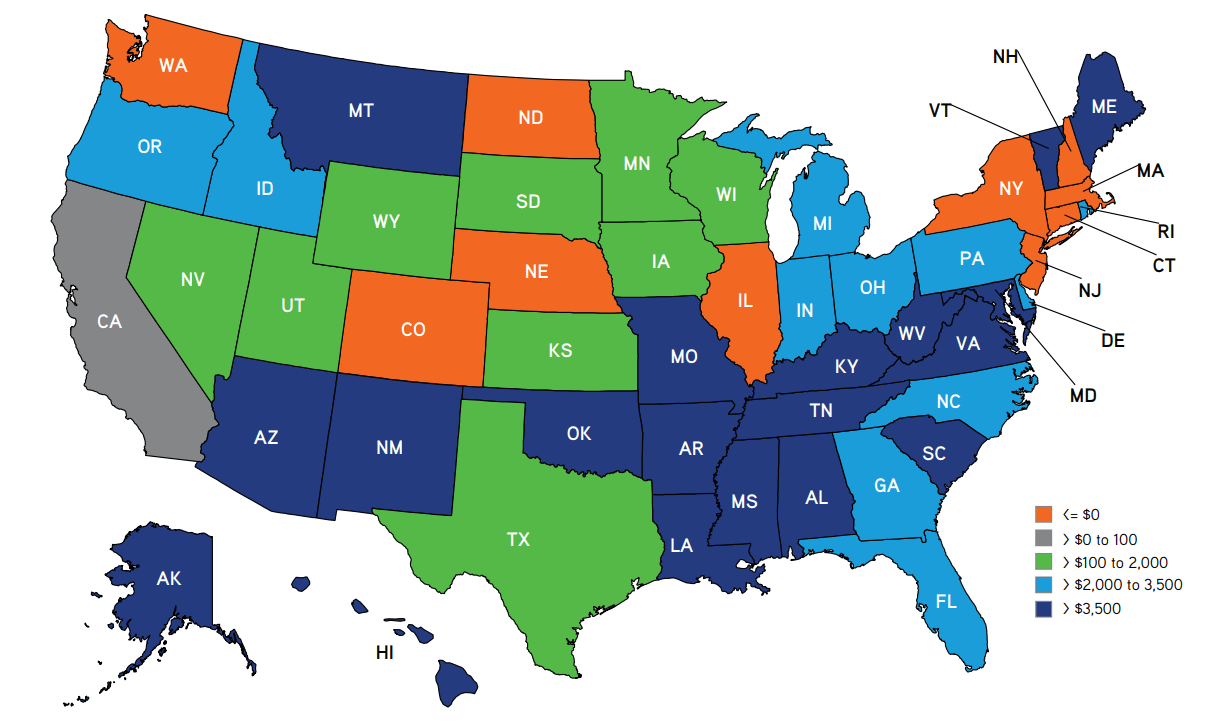
+ The state’s per capita balance of payments, -$1,792, continues to rank the state as one of the least favorable in the nation. New York’s negative per capita balance of payments is less than all but three other states. This is only a very slight improvement over 2016, when New York ranked the third to last with a per capita measurement of -$1,946.
+ New Yorkers’ per capita difference between payments made to the Federal government and spending grew slightly to $3,717 more than the national average in 2017 of a positive $1,925.
+ Since 2016, the US per capita balance of payment gap has grown by $202, reflecting an increase in Federal spending relative to tax revenue. New York has seen an improvement of $155.
+ While New York’s balance of payments has improved, it has not kept pace with the national average. New York’s shortfall compared to the national average continues to expand.
The Federal Tax Cuts and Jobs Acts of 2017 will have a significant impact on high-income earners in New York beginning in 2018, with changes that are expected to have flow-through effects on state tax burdens in New York. What remains less clear for the impact on New York — and its balance of payment calculations — is the potential for Federal spending cuts that may be enacted to absorb expected revenue losses and the extent to which those cuts would impact New York. States will be affected very differently depending on the nature of these changes.
Even if the overall distribution of tax burdens and Federal spending does not change dramatically, understanding how the Federal Budget is distributed across the nation and how that distribution has changed over time offers critically important information when evaluating the fairness and appropriateness of proposed changes in fiscal policy.